Texas Housing Market Outlook: Key Takeaways from NAHB's 2026 Economic ForecastJuly 28, 2026At this year's Sunbelt Builders Show, Dr. Robert Dietz — Chief Economist and Senior VP of Economics and Housing Policy for the National Association of Home Builders (NAHB) — delivered the keynote economic forecast for the housing industry. Dr. Dietz has testified before Congress on housing policy, previously served as the real estate expert for the Congressional Joint Committee on Taxation, and is a regular source for outlets like the Wall Street Journal and CNBC. Below is a recap of the key data points and themes from his presentation, with a focus on what they mean for Texas and the Houston market. The Big Picture: Productivity and Demographics Drive the Long RunDr. Dietz framed the session around two forces he sees as the real long-term drivers of the economy: productivity growth and demographic change. Everything else — trade policy, interest rates, political headlines — he characterized as more of a short-term footnote by comparison. He noted that near-term stability in policy and messaging remains elusive, and that the back half of the current political cycle is likely to stay contentious.
Overall Economic Forecast: 2% Growth, With CaveatsNAHB's baseline is 2% GDP growth for 2026, below the 3% Dr. Dietz sees as the economy's underlying potential. Notably, about half of that 2% (100 basis points) is attributed to AI-related investment. Recession risk in any given year runs an estimated 15–20%, and for 2026 that risk is elevated by a mix of factors, including:
On the positive side, consumer spending and credit performance have held up well, helped by the extension of the 2017 tax cuts. Mortgage and rent credit performance remain solid; the one line worth watching is FHA loan performance, which NAHB would treat as a risk signal if it climbed toward 8%, particularly if paired with a spike in unemployment. The labor market's slowest job-creation year in two decades came just before 2025, but the pace has begun to pick back up in 2026, with unemployment holding around 4.2%.
Housing's Structural Deficit — Still Underbuilt, But Narrowing
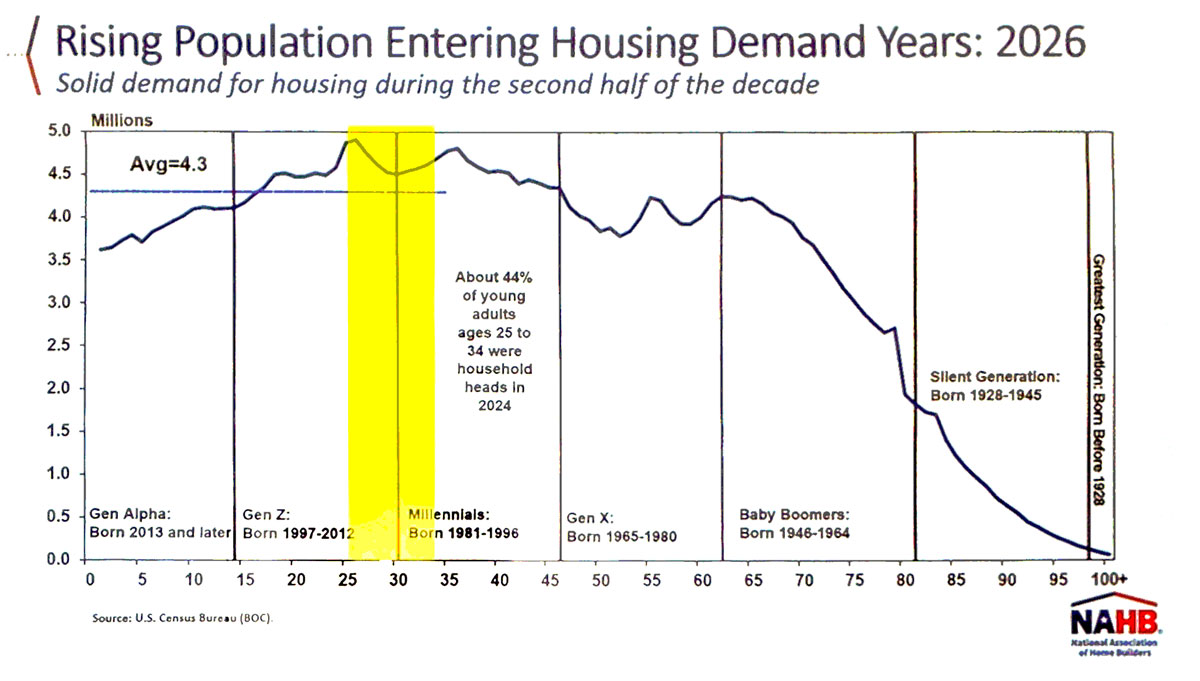
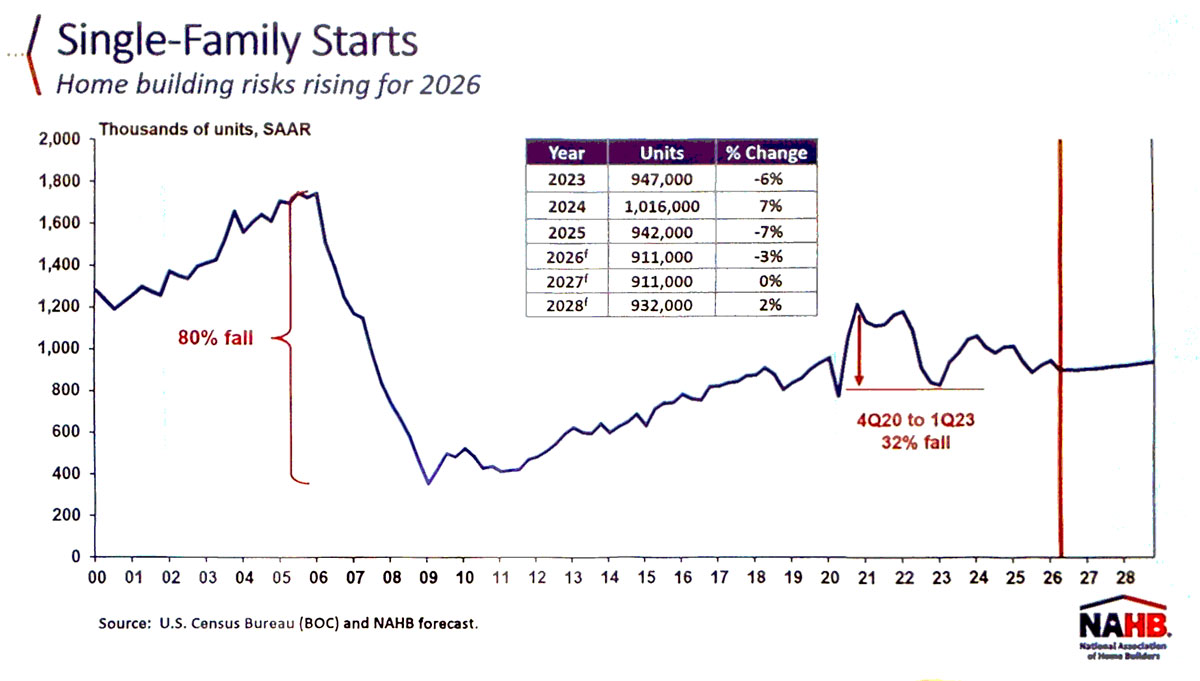
NAHB currently pegs the structural housing deficit at roughly 1.2 million homes, down from an estimate of 1.5 million three years ago — a figure notably smaller than some of the 4-million-plus estimates that circulate in the media. The narrowing isn't necessarily good news on its own: it's connected to rising vacancy rates in both for-sale and for-rent housing, meaning more homes are sitting unoccupied even as the country remains under-built overall. Dr. Dietz's central point on affordability: this is a supply-side problem, not a demand-side one. Subsidies or rent control don't fix a mismatch between population size and housing stock — only building more single-family homes and apartments, plus reinvesting in remodeling, will move the needle. He was clear there's no single silver-bullet policy; progress requires simultaneous work on labor availability, lot supply, and zoning reform. That demographic tailwind is part of the supply-side story. Millennials are moving through their prime homebuying years, and NAHB's data shows about 44% of adults aged 25–34 were already household heads in 2024 — a meaningful pool of continued housing demand for the back half of the decade. Single-Family Starts: A Bumpy Road to FlatNational single-family starts are forecast to come in around 911,000 units in both 2026 and 2027, down modestly from 942,000 in 2025 and well off the 2024 rebound of just over 1 million. NAHB's data shows a slight uptick projected by 2028.
Texas and Houston: Still Leading, But Permits Are Down Year-Over-Year
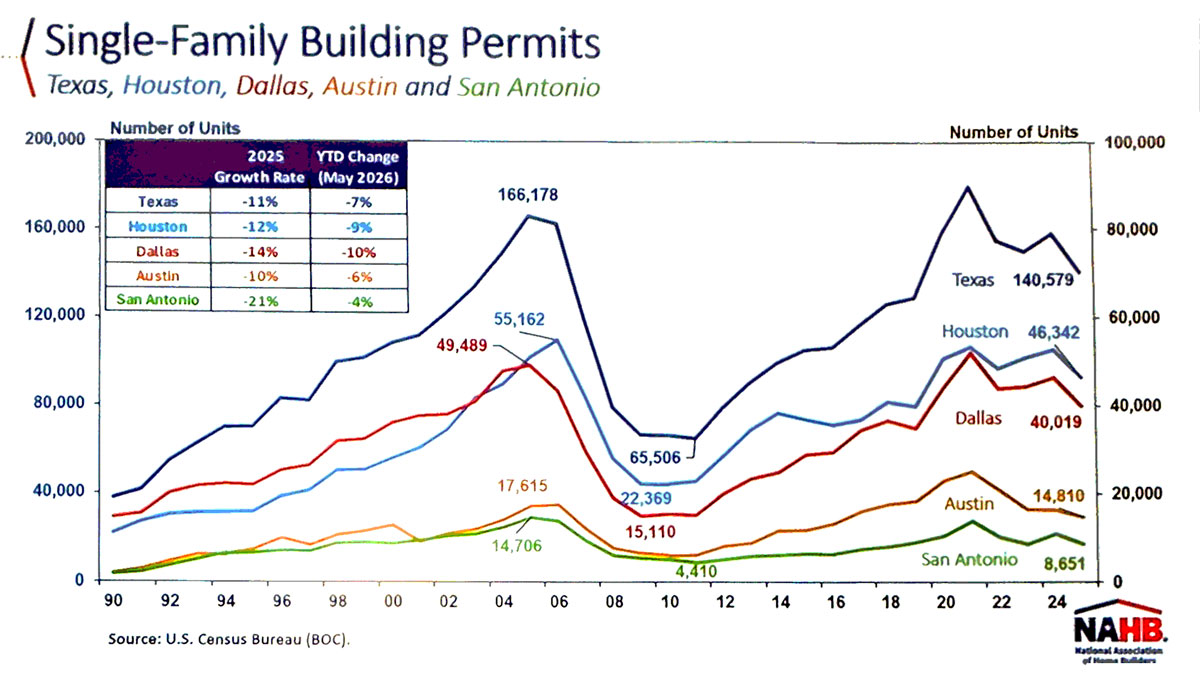
Texas and its major metros remain among the largest single-family markets in the country, but permit activity has softened across the board in 2025 and into 2026:
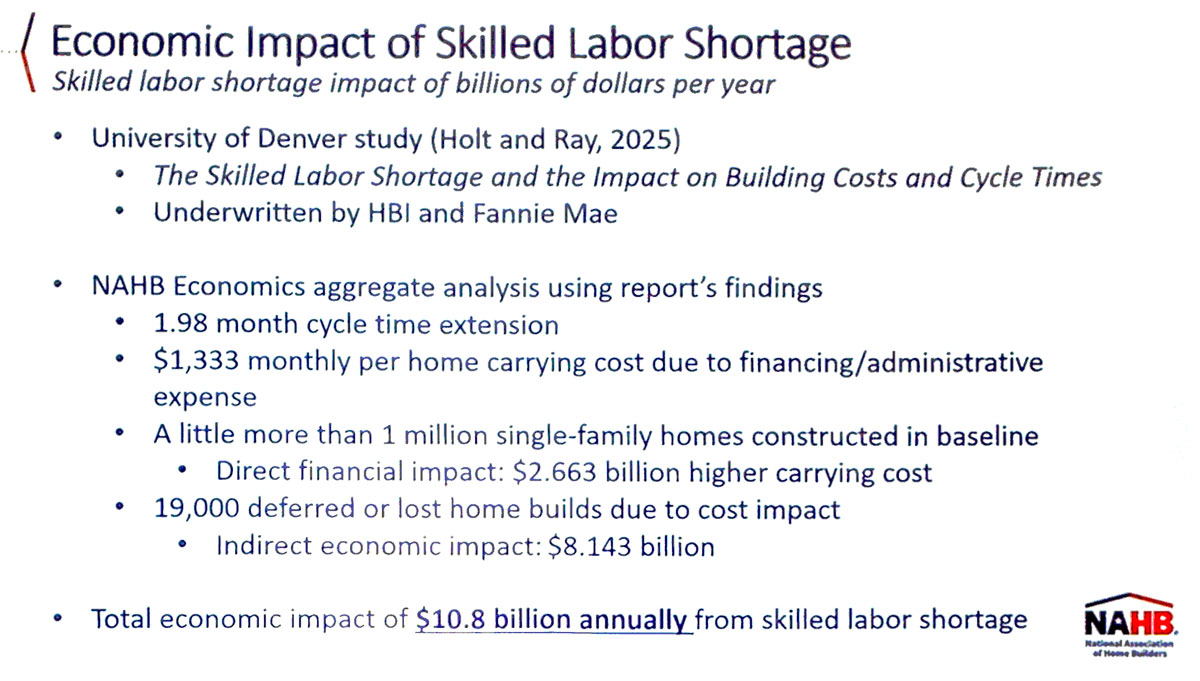
Despite the pullback, Houston, Dallas, and Austin all rank among the top five single-family markets in the country by permit volume — with Houston-The Woodlands-Sugar Land leading the nation at nearly 19,800 units year-to-date through May 2026. The Cost of Regulation: $131,734 Per New HomeOne of the more striking data points from the presentation: regulatory costs (zoning approval, compliance, code changes, standards beyond the ordinary, and related fees) now add an estimated $131,734 to the price of a new home — about 26.4% of the total price, and a 40% increase since 2021. Changes to building codes over the past decade account for the single largest slice of that total, at just over $40,000 per home. Labor: Easier to Find Workers, But the Shortage PersistsFinding construction labor has gotten somewhat easier than it was two years ago — despite increased immigration enforcement — but a meaningful shortage remains, and the share of the construction workforce made up of tradespeople (versus white-collar roles) has continued to decline. A University of Denver study (Holt and Ray, 2025), underwritten by HBI and Fannie Mae, put a dollar figure on the shortage's impact: roughly 1.98 months of added cycle time per project and $1,333 in additional monthly carrying costs per home, translating to an estimated $10.8 billion in total annual economic impact nationally. |
|
Summary compiled from the NAHB keynote economic forecast session at the Sunbelt Builders Show. July 2026 |
Explore our Blog
Sign up for email updates!
Join over 3,000 other marketing professionals to learn how to improve and advance your company's marketing.
The Archives
- OCTOBER 2026 (1)
- JULY 2026 (3)
- JUNE 2026 (1)
- FEBRUARY 2022 (1)
- DECEMBER 2021 (1)
- SEPTEMBER 2021 (1)
- AUGUST 2021 (1)
- JULY 2021 (1)
- JUNE 2021 (1)
- APRIL 2021 (1)
- FEBRUARY 2021 (2)
- DECEMBER 2020 (1)
- SEPTEMBER 2020 (1)
- AUGUST 2020 (1)
- MAY 2020 (1)
- JULY 2019 (1)
- AUGUST 2017 (1)
- JUNE 2015 (1)
- MARCH 2012 (1)
- AUGUST 2010 (1)